Our client planned to construct a multi-storey residential building on a site of one hectare which they recently acquired. A geotechnical investigation underlined anomalous depth to bedrock variations and Murphy Geospatial was contacted to perform a geophysical survey for foundation design purposes.
The brief
Murphy Geospatial was briefed to perform a geophysical survey to detect subsurface karst features, measure the depth to bedrock and assess the condition of the bedrock. This request was made following inconsistent results from a Ground Investigation which highlighted significant changes in the depth of bedrock.
The main goals of the survey were respectively to:
The first and main objective was to detect the presence of any subsurface karst features.
Map the depth of the bedrock.
Assess the strength and competency of the bedrock.
Murphy Geospatial proposed various geophysical methods in order to achieve the objectives set out by the client, including:
ERT (Electrical Resistivity Tomography)
Seismic Refraction
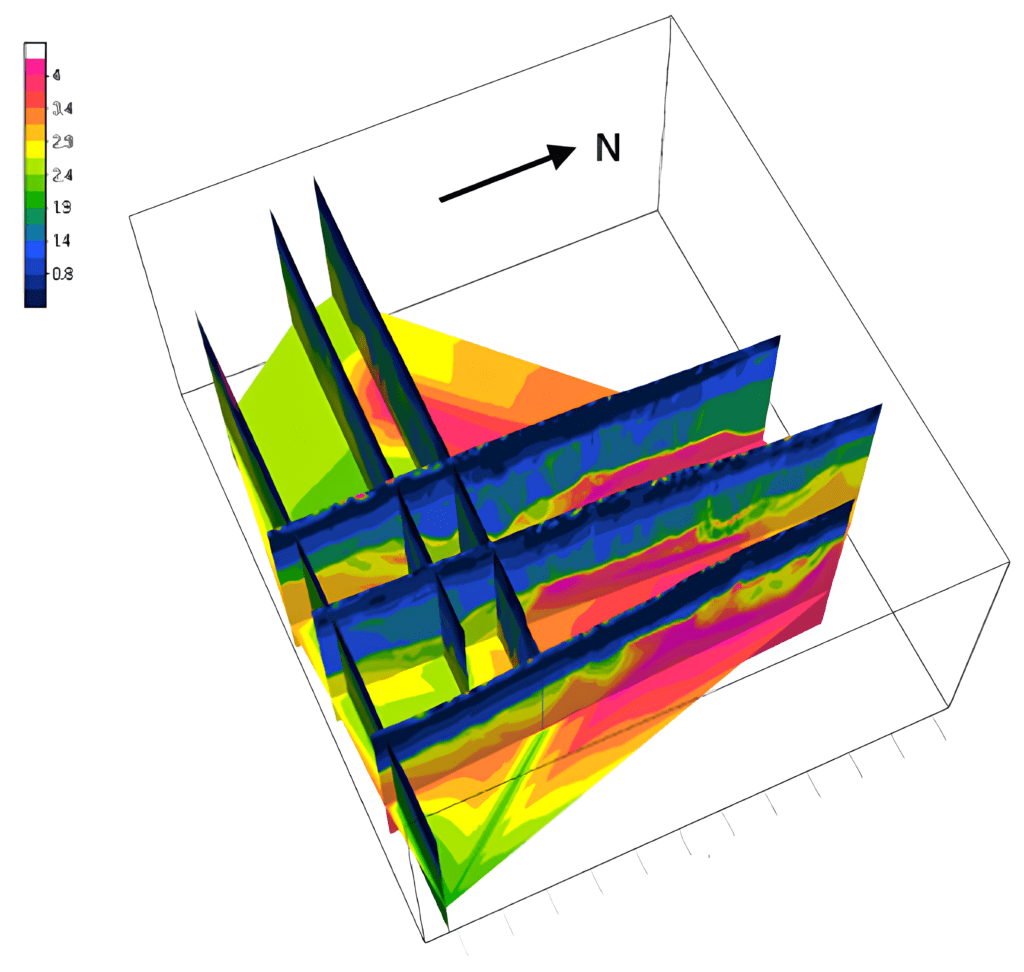
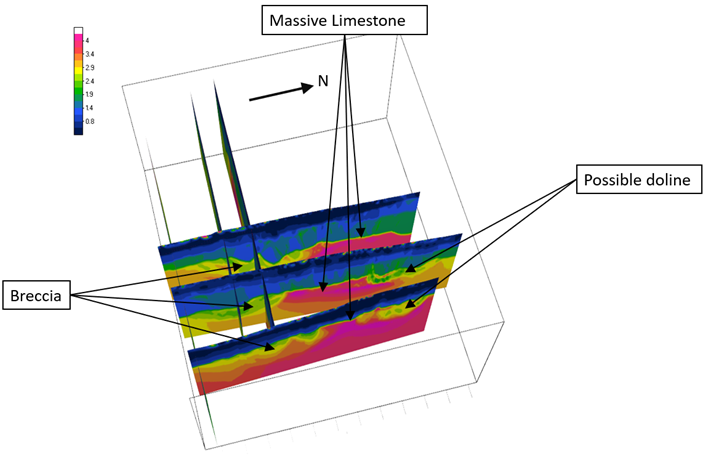
The data was used to generate a 3D seismic cube which helped our client to visualise the survey results.
The challenges
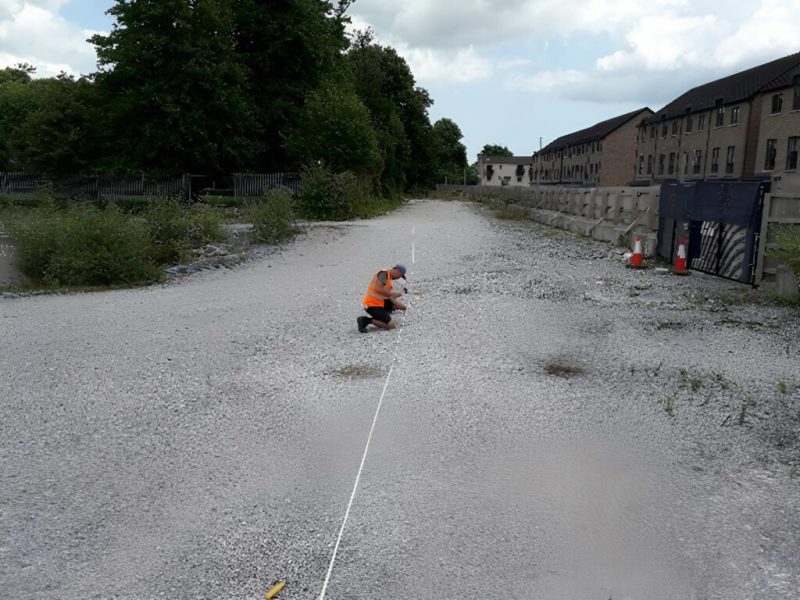
The main challenge was the presence of a compacted aggregate base and various concrete slabs on site. Both features prevented the planting of electrodes for ERT acquisition and impeded the ability of seismic refraction to properly assess the depth to bedrock.
Unsuccessful attempt to plant electrodes in the compacted aggregate base.
After notifying the client about this issue, the client excavated trenches to expose the natural soil beneath. Working hand in hand with the client, this proposition solved all problems related to ERT acquisition.
Our work
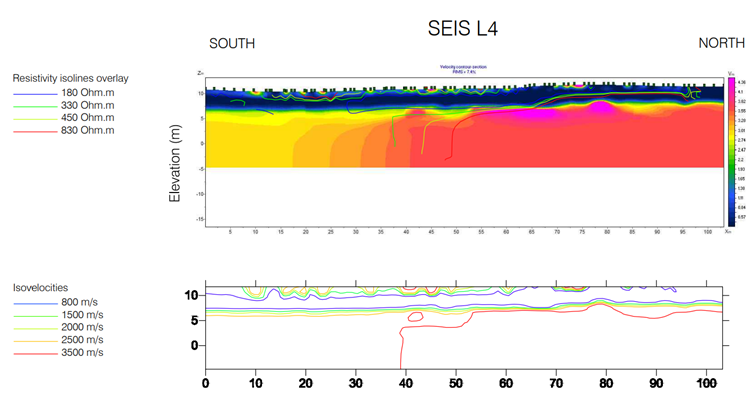
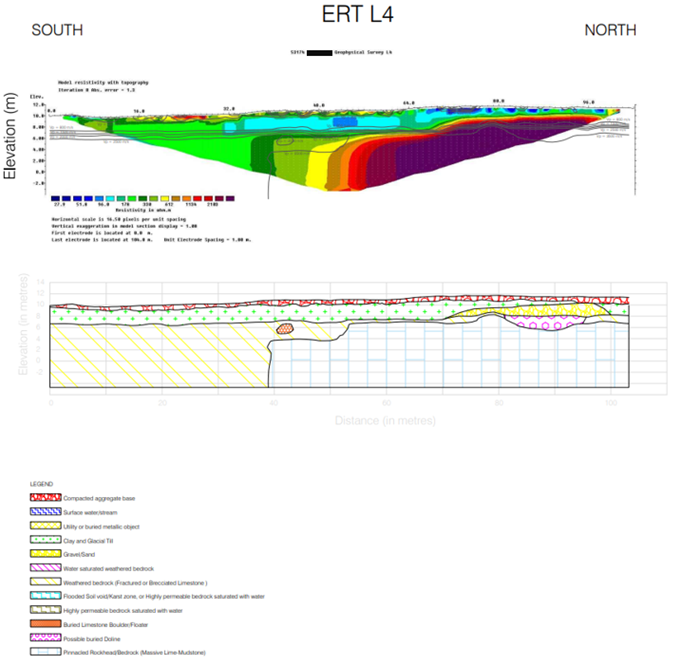
Processing of seismic and ERT datasets led to inversion sections, which, when combined, led to two types of deliverables for each section:
A geological interpretation section.
An iso-velocity section, showing the bedrock competence and its lateral variability.
Example of a seismic inversion section overlaid by resistivity isolines (top image). Isovelocities extracted from the same seismic inversion section (bottom image). Both are delivered in AutoCAD format. Seismic and ERT inversions consistently delineate the same bedrock contours, proving that the hidden layer’s corrections have been properly implemented. .
On top, example of ERT inversion section overlaid by seismic isovelocities. Both datasets consistently delineate the same bedrock contours. This fact confirms the efficiency of the corrective measures regarding hidden layers. At the bottom, geological interpretation section of the geophysical dataset. Once again, both sections are delivered in AutoCAD format.
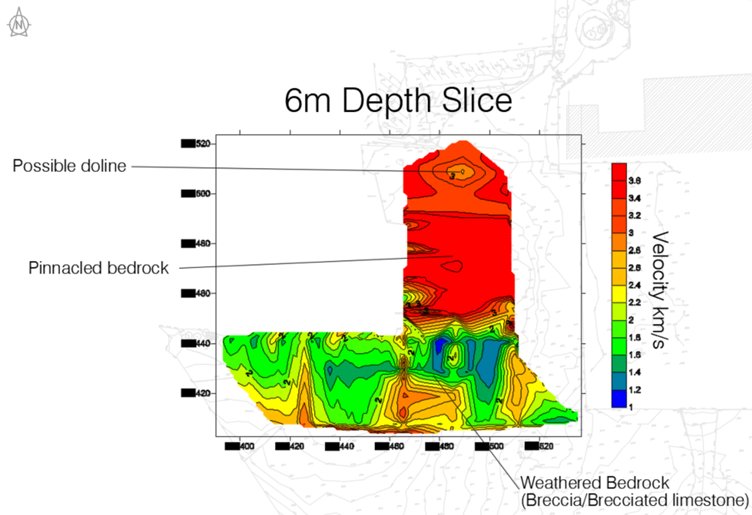
Seismic sections were later merged in a 3D seismic cube, enabling the delivery of a 3D surface map of the bedrock in AutoCAD format. After assembling the seismic cube, multiple depth slices were interpolated between lines.
The construction of the seismic cube provides a global point of view facilitating the interpretation.
Results
The main findings were respectively:
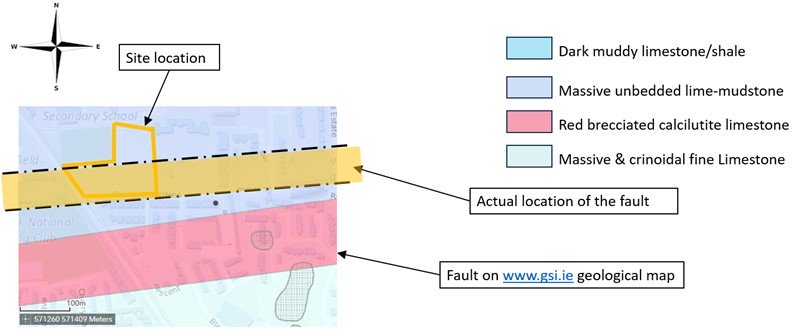
The discovery of a breccia fault crossing the site, unlike what was expected from geological maps.
The possible presence of a doline.
The possible presence of a flooded sinkhole within the breccia layer.
A 6m depth slice extracted from the seismic cube clearly delineated the presence of breccia in the southern part of the construction site. The firm and competent bedrock, lying at about 4m depth in the north, suddenly drops to 17m depth. This description is corroborated by the geotechnical boreholes.
Merging seismic sections into a single cube improves the interpretation of datasets. In this survey, a single depth slice (extracted from the seismic cube) summarized the whole survey. (Note: The Coordinates’ first 3 digits are hidden for confidentiality reasons).
This feature was initially expected to be located 150m further South according to the geological maps. The geophysical survey proved that it was, in fact, crossing the client’s site. This information will inevitably impact the foundation type and has enabled the client to make informed decisions to prevent structural damage to the planned building
In pink, breccia location foretold by the geological map. In orange, revised location of the breccia after the geophysical survey.